Scalar
values: Select
range of scalar values to be displayed
This property page defines which scalar values
should be used for calculating isolines and which color indices should be used
when plotting isobars. The smallest and largest scalar value for all elements
and for the elements contained in the selection for the scalar field plot are
shown in the dialog.
Following dialog shows the available options:
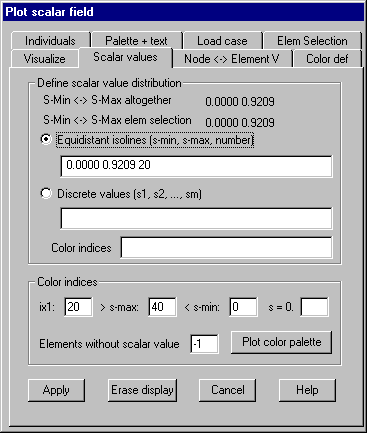
Equidistant
isolines (s-min, s-max, number)
With this
option the smallest and the largest value used for a sequence of equidistant
isolines must be given together with the number of steps between.
Discrete
values (s1, s2, ..,sm)
When
selecting this option up to 30 values for individual isolines can be given.
Additionally within the second input field color indices for color filling
between these isolines can be given. If not enough color indices are given
subsequent indices are incremented by 1 (beginning with ix1 if no indices at
all are given).
Color
indices
The
following color indices have to be given:
ix1:
Color index for the first isoline starting at s-min. This index will be
incremented by one for subsequent isolines.
> s-max:
Color index used by isolines greater than s-max respectively sm.
< s-min:
Color index used by isolines lower than s-min respectively s1.
Elements without scalar value: Color index for those elements whose scalar
values are not to be plotted. Giving index 0 plots with background color,
giving index –1 plots the elements with colors assigned to the elements.
Plot color palette: Currently set color values are plotted as a color palette.